
Navify Oncology Hub: delivering Patient Journey
Navify Oncology Hub is a collaborative workspace where providers can quickly access pertinent patient data, review evidence-based guidelines, and leverage longitudinal insights and analytics to enable timely, data-driven decisions at every stage of the care journey.
Context
Brief
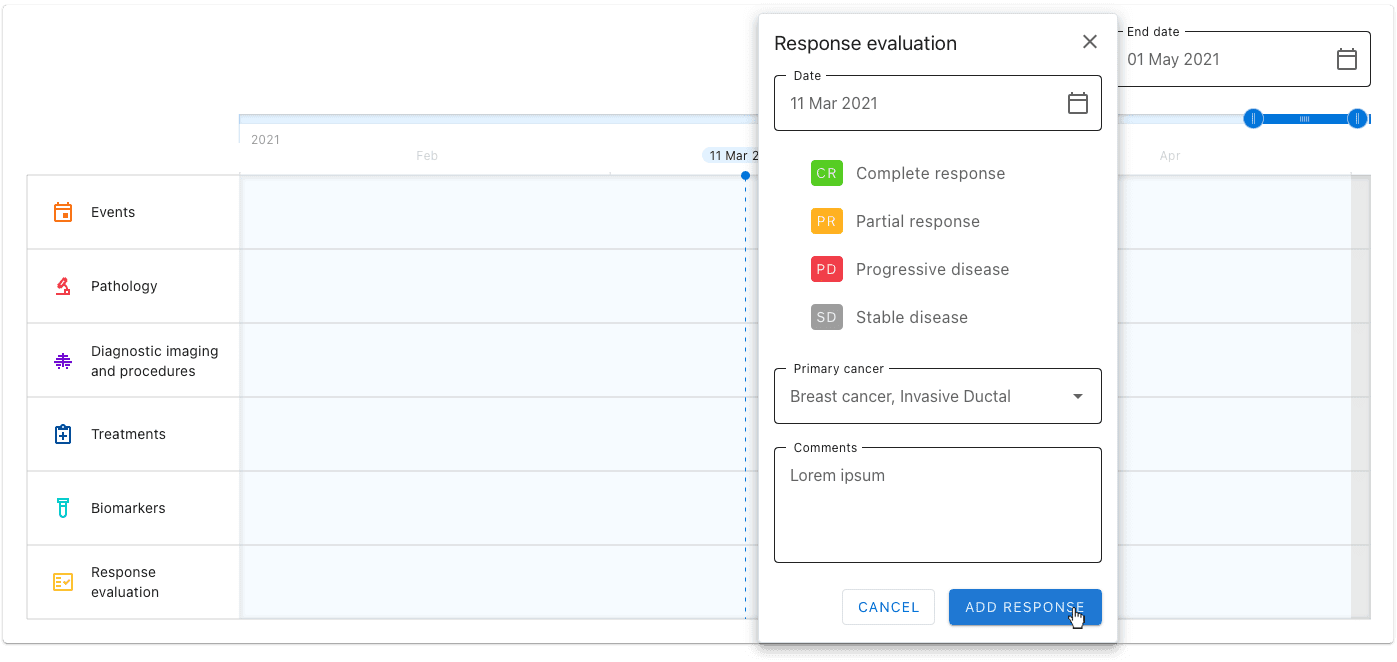
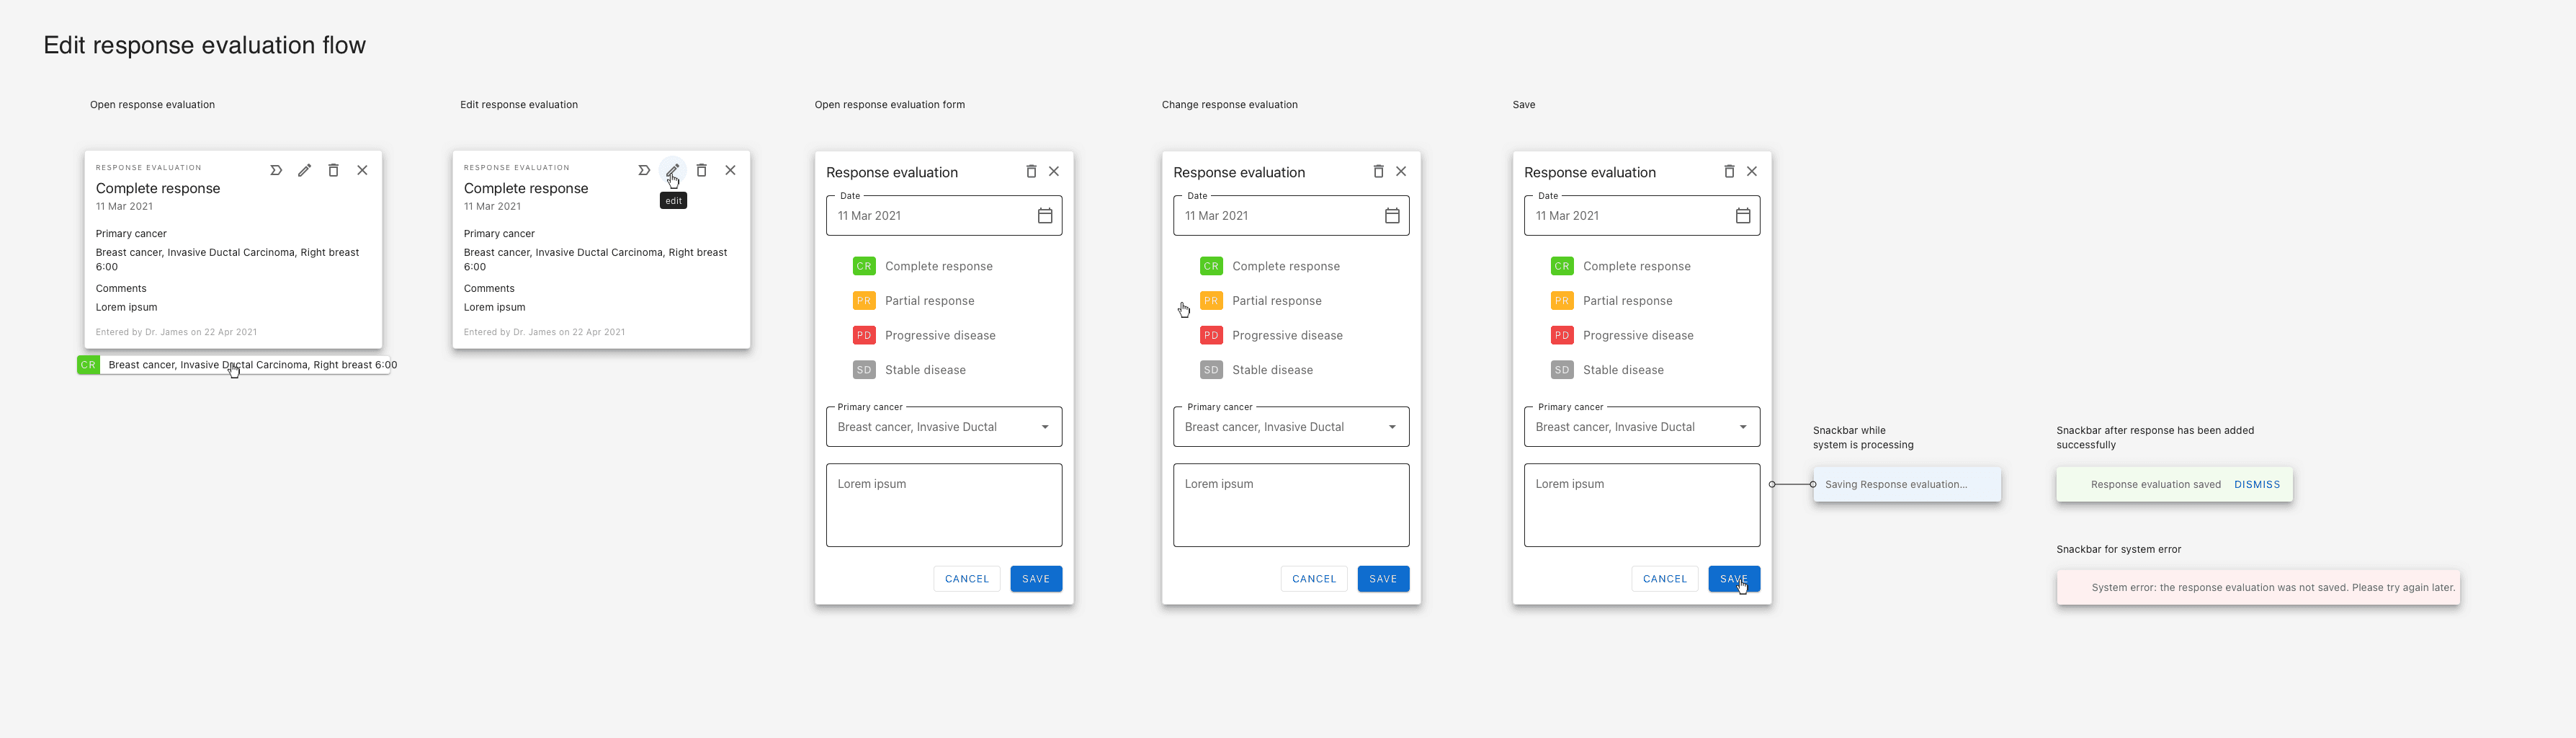
I was tasked to lead the delivery of a longitudinal data visualisation tool for Navify Oncology Hub, internally referred to as Patient Journey: an interactive timeline that displays all events since the patient’s diagnosis, organised in categories, so that healthcare professional within an oncology team can better understand and communicate patient cases.
Core team
Yael Olivo - Product designer
Joana Coelho - UX designer
Archana Dorge - Product manager
Samanta Xie - UX lead
Challenges
Design system adaptation
Navify’s design system, which was still under development at the time, was lacking the specific components for a timeline, so we worked closely with the UX lead to ensure our component library was consistent with the larger system.
Data consistency
We collaborated with the Product manager to ensure consistency in labeling between the data coming from the Electronic Medical Record and the Patient Journey, for easier integration of our tool into the existing oncology workflow.
Readability
The length of a Patient Journey can vary from a few months to years, with periods without any events and others with many. To ensure data readability at every zoom level, we created mock-ups for different time ranges with real (anonymised) patient data.
Delivery strategy
As the client’s internal priorities shifted, the deadline for this project was pushed ahead. To deliver on time, we worked with the engineering team to break down the feature into smaller components, so they could start development before production was concluded. We also produced a detailed estimation document that helped the management team with prioritisation for the MVP.
Methods & Tools
Estimation
UI design
Delivery strategy
Communication
Design system
Sketch
Zeplin
A-ah
Outcomes
Patient Journey MVP was delivered on time and handed over to Roche’s internal UX team

Learnings
Due to privacy concerns, it’s usually quite difficult to obtain realistic patient data to use in design projects. However, investing time and resources to anonymise real data greatly helps to avoid costly re-work down the line. Moreover, when real data is finally integrated into the product, the design team is often prevented from looking at the product in use, which creates a barrier to UX improvement that’s sometimes insurmountable.
Detailed estimation is a great communication tool with the management team: by breaking down work by the hour, it becomes much easier to push for prioritisation and reduce frustration within the team.
Understanding the structure and workflow of the engineering team can reveal opportunities to optimise production to avoid bottlenecks, especially on a tight deadline.
